


Optimising Process Conditions: neural network based modelling
By Rob Meier (https://www.linkedin.com/in/robert-meier-b81169a/)
Plant(-wide) process optimisation using computational toolboxes can be based on a variety of approaches.
The one methodology uses physical or so-called legacy models, so equations that describe the process using differential equations and so on. These are often available from the past, built using tools like, e.g. ASPEN. Another approach is Model Predictive Control (MPC) which uses a mathematical model of the process to predict the future states of a process as a function of inputs to the process. A MPC based system depends on the model and reliable measurements. MPC was described in a previous post by Jørgen K H Knudsen. Whereas all methods have, sometimes significant, differences, they have a larger number of commonalities (see a previous post by Rob Meier).
Neural network based methods are another class of data-driven models. Data driven models are expected, generally speaking, to be more accurate than physical models. Physical models typically describe the process as it was built or is running with accepted and applicable models. The word ‘describe’ was put in italics, to emphasize this point, as most of the times these physical models do not account for details in the process (we will come back to this at the end of this post).
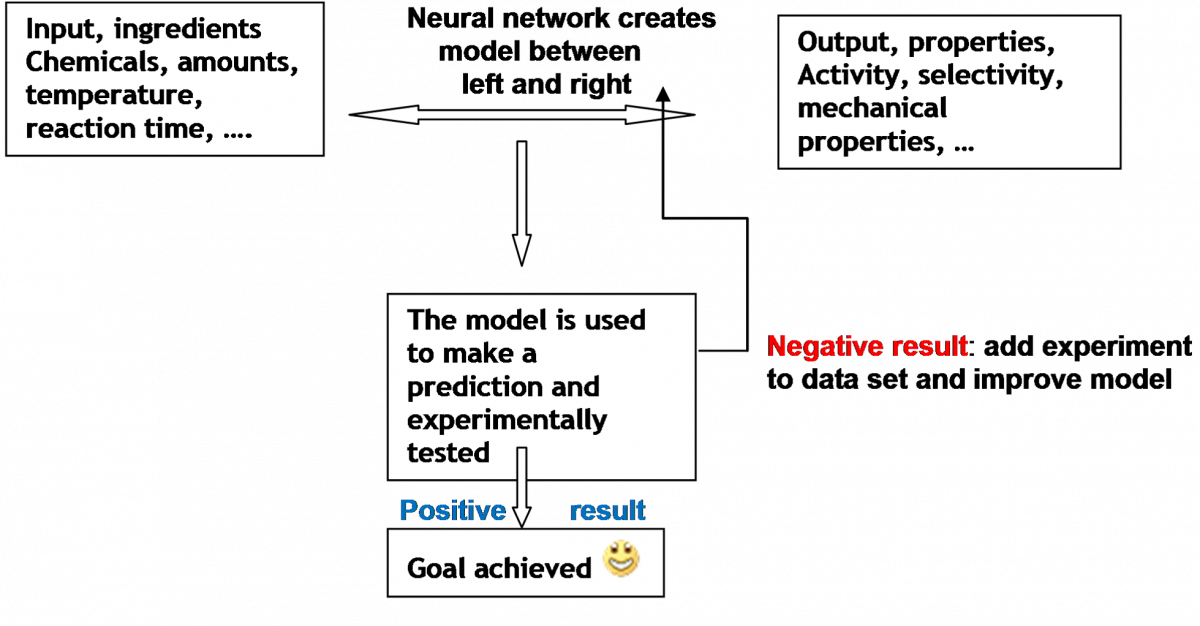
In data driven models, in case of production plants, plant data are being used to construct a model using, e.g. A(rtificial)I(ntelligence) methods such as Neural Networks (NN) analysis. A Neural Network based model, being a data driven model, establishes direct relations between input (left hand block in the scheme below, ingredients, reaction conditions, etcetera) and output (quality and quality of project, by-product levels, materials properties when relevant, and so on). Mathematical relations, though without having an explicit physical meaning, are established describing the relation between the ‘input’ and ‘output’ parameters. For each output parameter or property, an independent relation is established.
Model for each property: P = f(all ingredients)
Neural networks are, as the name implies, supposed to be resembling the way a brain works, with neurons and connections between them. In common NN implementations, the signal at a connection between artificial neurons is a real number, and the output of each artificial neuron is calculated by a non-linear function of the sum of its inputs. Artificial neurons and connections typically have a weight that adjusts as learning proceeds. The weight increases or decreases the strength of the signal at a connection. Artificial neurons may have a threshold such that only if the aggregate signal crosses that threshold is the signal sent. Typically, artificial neurons are organized in multiple layers. Different layers may perform different kinds of transformations on their inputs. Signals travel from the first (input), to the last (output) layer, possibly after traversing the layers multiple times. These layers, numbers of neurons and connections, including the non-linear functions that modify the signal strengths, lead to a large flexibility to train the network as it is called and therewith establish relationships between input and output parameters, between ingredients and properties. For a very readable reference see Neural Networks in Chemistry, By Johann Gasteiger” and Jure Zupan, Angew. Chemie Int. Ed. Engl. 1993. 32, 503 -521.
Neural network based modelling has, when the objective is plant optimisation, a number of distinct advantages (which it shares with many other data driven models):
-
very complex (many parameter) situations can be easily dealt with: almost all processes involve many parameters, at least a few dozen!
-
no intermediate detailed analysis required (this analysis is often not possible and also expensive)
-
NN analysis inherently allows for non-linear behavior and correlations between variables: in many cases we do not know whether there is non-linear behavior or not, and linear models might not be the right choice (MPC is now getting non-linear options, as in other activities carried out in the COCOP project, see reference above)
-
the use of NN tools costs relatively little time, and they have the natural potential to eventually become a real-time process control tool including continuous updating of the model upon including new process data
-
because predictive nature and the nature of the input data set, we have direct handles to improve. Moreover, the input data set can also involve a parameter such a, e.g., a valve setting. Actually, ideally the input parameter set should contain and only contain all parameters that can be actively controlled as these are the only variable settings in the entire process and therewith the parameters that determine the output parameters (properties) of the process of the process. Exceptions are parameters that are crucial but cannot be handled actively in the same way: an example is a catalyst that deactivates slowly.
As for any data driven model, first of all, data curation has to take place: removal of incorrect data, which can be due to all sorts of causes. Most importantly the data set should contain data on all relevant parameters that determine the output properties. But with many parameters we need a lot of experimental data, as otherwise overfitting occurs. If insufficient experimental data are available, which is often the case, it is highly likely very many solutions can be generated fulfilling the requirement of, e.g. higher yield, as there are many input related parameters involved. Whereas many input related parameters are measured very frequently, e.g. every few seconds or every few minutes (temperature, pressure, flowrate, continuous parameters which values are stored very frequently), the quality or quantity of produced material if usually not measured at that rate unless it is about piece wise production in which case this is done much more frequently or even every single piece.
So the situation can be, and this is not uncommon, that we have few data, more precisely little variation in the data set, to allow a good model to be established. Many solutions suggesting higher quality of the product can be generated, but these are all mathematical solutions and not a priori physically appropriate solutions. One approach to solve this dilemma is to deliberately create further data of the kind needed. I have adopted a different approach which is involving experienced plant staff. How does this work?:
-
Take the data and build a model, generate a limited set of predictions
-
Discuss with plant engineers about the value of these predictions, and integrate the expert knowledge (but only what is known for sure!!!!!) into the search for new solutions
-
Iterate a number of times, in fact as often as required, and solutions are found that: are good solutions according to the model and are solutions which are acceptable to plant engineers
When the model is established one can start making predictions. In the chemical arena, where often catalysts are used, it is frequently the case that pushing capacity leads to lower quality whereas high quality leads to lower capacity. Using data driven models one can ask the model to look for settings (= all input related parameters) that have both a somewhat higher capacity as well as higher quality.
Whereas building the models takes its time, making predictions using a data driven model such as based on neural networks require almost no computational resources, and therefore it can be easily used on-line. On the contrary, physical models can also be very complex requiring long computational times for optimisation.
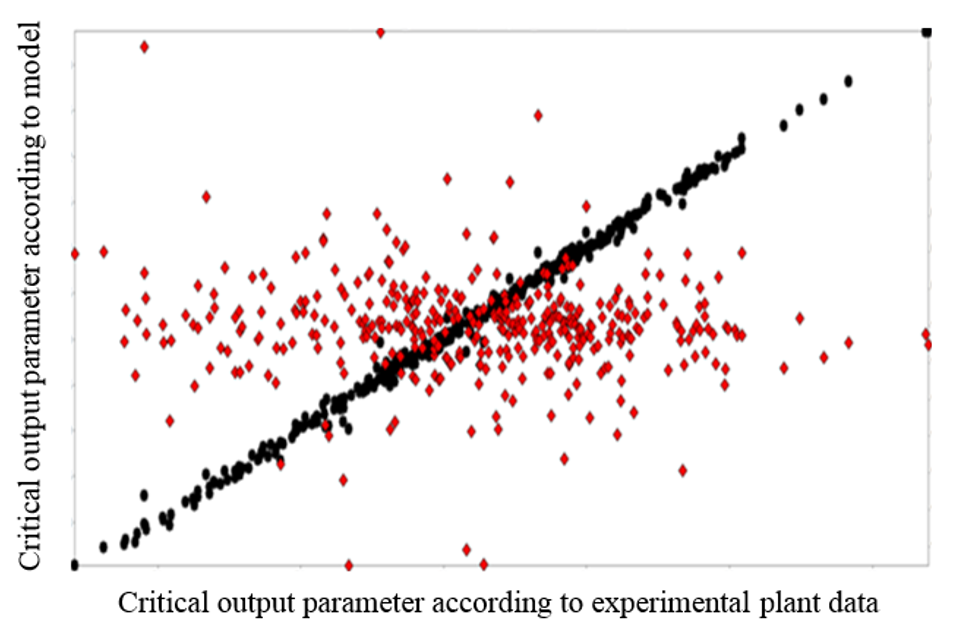
In the plot below the black data points show the relation between experimental and model described output parameter, in this case the yield of a chemical plant where the scale is roughly between 85 and 90%. The engineers associated to the plant commented that this was by far the best model they had ever seen for this plant, and this is an old process with a lot of experience and existing physical (e.g. ASPEN) models. The red data points are the differences, which were typically 0.1% at maximum. As in bulk processes 1% improvement is very much money and also a significant contribution to sustainability (less waste, less energy per ton of product), the accuracy of a fraction of 1% is required for reliable predictions. Data driven models can, if appropriate input is available, be generated with very high accuracy.
Follow the discussion in the COCOP Debate Group of Linkedin

")
")
 (MSI)")
")

")